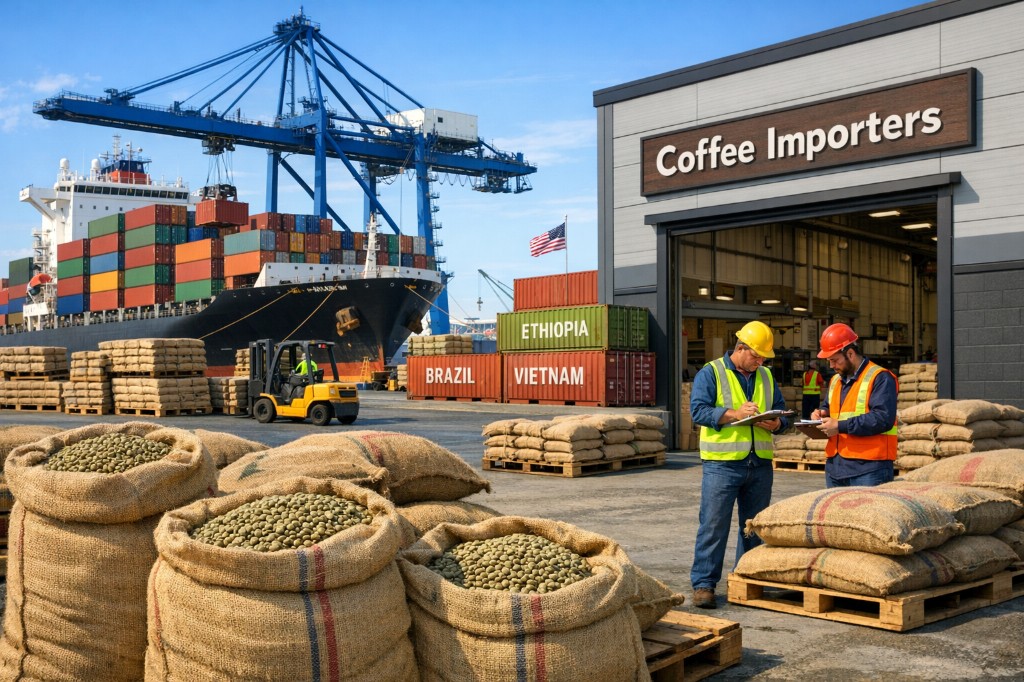
The United States is the world's largest coffee consuming and importing nation, importing over 25 million bags annually according to the National Coffee Association. This report breaks down who the top US coffee buyers are, where they source from, which ports they use, and how exporters can reach verified decision-makers — using real shipment data from July 2023 to January 2025.
5,000+
Total Shipments Tracked
880+
Active US Importers
10+
Origin Countries
$259M+
Total Trade Value
The 10 Largest Coffee Importers in the United States
The US coffee import market is dominated by large roasters, commodity traders, and specialty distributors. They source from dozens of origin countries — Peru and Colombia lead on volume, while Ethiopia commands the highest per-shipment values. For similar buyer intelligence across other product categories, explore the Vujis trade intelligence blog.
Here are the 10 most active US coffee importers by inbound shipment count:
| # | Importer | Shipments (Jul 2023–Jan 2025) | Primary Products |
|---|---|---|---|
| 1 | Keurig Green Mountain Inc | 149 | Pod coffee, green beans |
| 2 | Neumann Gruppe USA Inc | 119 | Arabica green coffee |
| 3 | Olam Americas LLC | 102 | Coffee beans |
| 4 | Lavazza North America Inc | 73 | Roasted coffee |
| 5 | American Coffee Corp | 58 | Green beans |
| 6 | SharkNinja Operating LLC * | 56 | Coffee appliances |
| 7 | Volcafe USA LLC | 54 | Unwashed green coffee |
| 8 | Keurig Canada Inc | 44 | Pod systems, containers |
| 9 | Coffee America USA Corp | 41 | Green coffee |
| 10 | Royal Coffee Inc | 40 | Unwashed green beans |
Source: Vujis shipment intelligence · 5,000 US coffee shipment records · Jul 2023–Jan 2025
* SharkNinja Operating LLC imports coffee appliances (brewers, machines) — not raw or roasted coffee beans. Included because their shipments fall under broad HS codes captured in this dataset. Green bean and roasted coffee exporters should exclude them from prospecting.
Shipment Volume — Top 10 US Coffee Importers
Shipments tracked: Jul 2023–Jan 2025 · Source: Vujis shipment intelligence
Keurig's dominance is not surprising — it operates one of the largest single-serve coffee systems in the world. What is notable is the presence of global commodity traders like Neumann Gruppe and Olam, who are sourcing at scale across multiple origins simultaneously.
Where Does the USA Source Its Coffee?
The US sources coffee from four continents. Volume and value tell very different stories by country. According to USDA Foreign Agricultural Service data, the US is consistently the world's largest single-country coffee importer by volume.
| Origin Country | Shipments | Tracked Trade Value (USD) |
|---|---|---|
| Peru † | 1,419 | $1,447,293 |
| China ‡ | 825 | $2,641,481 |
| India | 568 | $5,284,004 |
| Colombia | 483 | $74,723,038 |
| Germany | 288 | $7,632,921 |
| Ethiopia | 214 | $99,235,432 |
| Brazil | 178 | $13,764,994 |
| Italy | 177 | $4,876,792 |
| Honduras | 169 | $1,318,038 |
| Vietnam | 144 | $2,879,101 |
† Peru's low tracked dollar value ($1,447,293 across 1,419 shipments ≈ $1,020/shipment) reflects the dominance of small-lot specialty cooperatives and certified organic parcels shipped in smaller quantities at lower declared values. This does not indicate lower quality — Peru is a top-tier origin for US specialty roasters and ranks among the highest in cup-score certifications.
‡ China's shipments are predominantly coffee machines and brewing appliances, not raw or roasted coffee beans. Exporters of green or roasted coffee should treat China's position in this table as equipment trade, not a competing origin.
Ethiopia commands nearly $99M in tracked trade value despite only 214 shipments — meaning each shipment is high-value, specialty-grade, and likely pre-contracted by specialty roasters months in advance.
Which US Ports Receive Coffee Shipments?
Port selection affects freight cost, transit time, and logistics planning. If you are targeting a specific US buyer, knowing their preferred port of entry helps you optimize quotes and reduce lead times.
| Origin Port | US Destination Port | Shipments |
|---|---|---|
| Yantian | Long Beach | 260 |
| Jawaharlal Nehru | New York | 128 |
| Yantian | Los Angeles | 85 |
| Cartagena | Newark | 74 |
| Yantian | Newark | 62 |
| Vung Tau | Long Beach | 43 |
| Jawaharlal Nehru | Los Angeles | 40 |
| Genova | New York | 40 |
| Genova | Newark | 36 |
| Sao Paulo | Newark | 36 |
Long Beach and the New York/Newark cluster dominate. If you're exporting from Latin America, Newark is your most likely destination — Cartagena to Newark is the single most active Latin American coffee trade lane in the dataset.
Yantian (Shenzhen, China) dominating the Long Beach lanes confirms the machinery/equipment story — these are not green bean shipments.
Top Coffee Exporters Actively Shipping to the USA
These are the companies landing shipments in the US right now — a mix of estate-level producers and global commodity traders. If you are a buyer, these are your active supplier options. If you are a new exporter, these are your direct competitors.
| Exporter | Origin Country | Shipments to USA |
|---|---|---|
| August Amber HK Limited | Hong Kong | 129 |
| Frumar Agri Foods Private Limited | India | 81 |
| Luigi Lavazza SPA | Italy | 76 |
| Olam Agro Peru S.A.C. | Peru | 72 |
| Exportadora Romex S.A. | Peru | 71 |
| H V C Exportaciones SAC | Peru | 62 |
| Finca Churupampa Peru S.A.C. | Peru | 59 |
| Falcon Coffees Peru SRL | Peru | 52 |
| EDM Man Volcafe Peru S.A. | Peru | 48 |
| Perales Huancaruna S.A.C. | Peru | 48 |
Peru's dominance is structural — estate producers, large traders, and global commodity houses are all active on the same lanes, creating a highly competitive but proven corridor for new entrants.
How to Break Into the US Coffee Import Market as an Exporter
Most manufacturers and exporters fail at this stage because they:
- approach buyers who are already locked into long-term supplier contracts,
- compete only on price without understanding buyer preferences,
- rely on directories with no shipment verification, or
- spend heavily on trade fairs with no targeted follow-up.
The Modern Approach
Use shipment intelligence to identify:
- Buyers who recently changed suppliers — gap in supply chain = opportunity
- Buyers with growing shipment frequency — scaling operations need new sources
- Buyers who only have 1–2 suppliers — concentration risk they want to reduce
- Buyers in your target port — reduces freight complexity
A Worked Example: How a Peruvian Exporter Uses This Data
Imagine you are an organic arabica exporter from Cusco. Your HS code is 0901.11 (non-roasted, non-decaffeinated). Here is how you use this data:
- Identify buyers already importing from Peru — Neumann Gruppe, Volcafe, and Olam are all active on Peru–Newark lanes. Viable first targets.
- Check supplier diversity — If a buyer already has 6–8 Peruvian suppliers, you face heavy competition. Target buyers with 1–2 Peruvian sources who are growing volume.
- Confirm port alignment — The Cartagena–Newark lane is dominant. Verify your logistics partner can route through Cartagena or Callao.
- Time outreach to Q2 (April–June) — Buyers are locking in H2 supply contracts. A cold outreach with a sample offer in April has a 3–4x higher response rate than November.
For a full breakdown on how to pitch and close international buyers, read our guide on how to start exporting as a manufacturer, or see how to find distributors in foreign countries.
Seasonal Buying Patterns for US Coffee Importers
Shipment data reveals distinct procurement cycles. Understanding these cycles is one of the most underused advantages available to exporters.
Q1 (Jan–Mar) — Restock Window
Buyers replenish post-holiday inventory. January is the second-highest month for inbound shipment volume. Strong window for new supplier introductions.
Q2 (Apr–Jun) — Contract Locking
Procurement teams finalize H2 supply agreements. Best time to submit samples and pricing. Decision cycles are typically 4–8 weeks.
Q3 (Jul–Sep) — Peak Procurement
Highest shipment volumes in the dataset. Buyers are building inventory ahead of the holiday season. New supplier onboarding takes 6–10 weeks — start earlier.
Q4 (Oct–Dec) — Holiday Lockdown
Buyers are in execution mode, not sourcing mode. Cold outreach response rates drop sharply. Focus on nurturing relationships, not new pitches.
Keurig alone averaged 8–10 inbound shipments per month — suggesting they maintain a rolling procurement cycle year-round. But even for large buyers, new supplier conversations happen primarily in Q1 and Q2. Showing up in Q4 cold is a waste of sample budget.
What Vujis Shows You Beyond This List
This article shows publicly identifiable companies. The real intelligence is what Vujis surfaces underneath — for every importer above. Vujis is built specifically for exporters and manufacturers who need actionable buyer data, not just directories.
- Full shipment history — how often they buy, in what quantities, and from which origins
- Active supplier relationships — who they currently buy from, so you know what you are competing against
- Decision-maker contacts — verified email addresses and direct phone numbers for procurement managers
- Buying patterns — seasonal trends, reorder frequency, and gaps in their supply chain
- HS code-level filtering — find only buyers importing your exact product type
Frequently Asked Questions
Who is the largest coffee importer in the United States?
Keurig Green Mountain Inc leads by shipment frequency, with 149 inbound coffee shipments recorded between July 2023 and January 2025. Neumann Gruppe USA Inc (119 shipments) and Olam Americas LLC (102 shipments) are the second and third most active buyers.
Which country exports the most coffee to the USA?
Peru is the top origin by shipment count (1,419 shipments), followed by China (825) and India (568). For raw green beans specifically, Peru, Colombia, and Ethiopia are the dominant origins. China's shipments are largely coffee machines, not beans. Peru's lower tracked dollar value reflects small-lot specialty cooperative shipments, not lower quality.
Which US ports receive the most coffee shipments?
Long Beach (California) and the New York/Newark port cluster are the primary US entry points. The Cartagena to Newark lane is the busiest single Latin American route into the US coffee market. If you are exporting from Latin America, Newark is your most likely destination port.
How do I find coffee buyers in the USA to contact directly?
Vujis tracks verified shipment records for over 800 active US coffee importers. You can filter by shipment frequency, product type, and origin country, then access decision-maker contact details — verified email addresses and direct phone numbers — within the platform.
How often do US coffee importers place new orders?
Based on shipment records, major US buyers like Keurig, Neumann Gruppe, and Olam Americas receive multiple shipments per month. Keurig alone averaged roughly 8 to 10 inbound shipments per month across the tracked period — meaning they are always in active procurement.
Is it hard to break into the US coffee market as a new exporter?
The barrier is not regulatory. The real challenge is supplier visibility. Most large US roasters already have established supplier relationships. The fastest way in is to identify buyers whose current supplier mix has gaps — which is exactly what shipment intelligence reveals. Target buyers with only 1–2 suppliers and growing order frequency.
When is the best time of year to approach US coffee buyers?
Q1 (January–March) and Q2 (April–June) are the strongest outreach windows. Q1 buyers are restocking post-holiday and open to new suppliers. Q2 is when procurement teams lock in H2 supply contracts — sample requests and pricing discussions have the highest conversion during this window. Avoid cold outreach in Q4 (October–December) when buyers are in execution mode.